


Trump has claimed that the 2024 US Presidential election was rigged. In this post, I want to take that at face value, analyze the results shared by people looking for election fraud, and understand the context of election fraud at large.
The scary part – perhaps even crazy-making – is that to a layman there does appear to be fraudulent data patterns. Understanding them fully, and what they mean (there may be boring explanations, or there may not), will take both time and heavyweight emotional processing.
We place nearly blind trust in a system which has tremendous power over our future, and is meant to represent our personal choices. We have every right to understand why we should trust the results even when we are not technical experts. And regardless of what the data may show (personally, I expect seeing fraud from both sides), this right is what keeps our country democratic, not dictatorial.
On March 7th 2025, Trump on video declared without context:
“What happened is… they rigged the election, and I became president. So that was a good thing.”
Well Mr. President, in whose favor was it rigged? Let’s take a look. 🫡
There’s four sections to this post:
Election fraud is possible in the US. There’s a court-proven track-record
Putin’s regime has expertise in election fraud, and we’ve learned how to see it
Looking at the data 2024: Weird things happened with the votes
How you can help
Election Fraud in the United States
Sources include Harpers - How to Rig an Election (2012), ChatGPT (which links to further sources in turn), and HBO’s 2006 documentary Hacking Democracy.
The USA has both a long and rich history of election fraud, and has simultaneously maintained a virtually un-assailable reputation for election integrity. We are in many ways so conditioned to trust our elections that in earnestly questioning them we often must work through layers of fear, insecurity, shame, and re-evaluation.
That has certainly been the case for me. It has helped to accept that one: there is always fraud, at least at some scale, and two: we have a right to demand open and scientific study of the data.
Here are some examples of historical fraud, carried out by both parties:
[New York City’s Mayor’s Office] Tammany Hall was bought for more than a century.
[Lyndon Johnson’s] biography describes buying votes from his “fixer” to get his Senate seat in Texas
[2003, Mayor of East Chicago, Indiana] The mayor had such widespread absentee ballot fraud that it was nullified by the state supreme court.
[2009, Troy NY Primary] Four officials plead guilty in absentee ballot fraud in the party primary.
[2014-2016, Philly Primary] An election worker plead guilty to adding fraudulent votes in primary elections for years, focusing on specific precincts in which he was bribed. A congressman was indicted for organizing the scheme.
[2018, North Carolina U.S. House] Ballot tampering of absentee ballots led to a do-over of a U.S. House election. One of the rare elections invalidated due to ballot fraud.
[2000 Presidential Election] Touchscreens were on video, in mass, casting votes for a different candidates. Florida counties were caught changing vote totals and sending false receipts, including negative votes for one candidate. The entire Diebold source code leaked, and it turned out any election worker could change vote totals using a spreadsheet.
[2004 lost ballots] During the 2004 presidential election, North Carolina experienced an electronic voting machine malfunction that caused 4,438 votes to disappear forever. “Random” selections for spot-checks in Ohio were not actually random. Memory cards were able to be “preloaded” with negative votes. And the list goes on.
The past 100 years of US voting machine technology goes back and forth between reliability and convenience. In the 1900s, the first machines which mechanically tallied votes were used, but they had no paper trail or way of auditing. These were switched out for paper ballots until the onset of touchscreen Direct Recording Electronic (DRE) voting machines in the 2000s, which again had no papertrail. Over the next 20 years those machines were decertified as fraud-ready and replaced with what we have today: paper ballots which are filled in, and then optically scanned by tabulator machines.
Meanwhile, Europe skipped all this and just stayed on classic paper ballots. The ability to verify ballot-counting with one’s own eyes and without technical knowledge is even considered a German constitutional right.
U.S. States have guidelines and thresholds for when to do a recount, when and how to do spot checks, how to test machines and verify results, and so on. These are not always perfect, as we’ll see below.
Election Fraud in Russia
It is widely believed by many analysts that electoral manipulation under Vladimir Putin’s leadership dates back to the early years of his presidency. Since his first presidential win in 2000 observers have noted unusual patterns in vote tallies. These include margins exceeding 70% in key contests, such as a constitutional amendment to allow him more terms.
One of the most compelling indicators of potential fraud in Russian elections is what researchers refer to as the "Russian Tail." In a genuinely free and fair election, the polarity of one candidate across polling stations typically forms a smooth bell curve—a natural outcome of statistical variation. Most polling stations are near the average for the election, and a low number are heavily favoring one candidate or another.
However, in several Russian and Russian-influenced elections, the shape of the curve instead appears to be made up of two bell curves overlaid. This indicates a second normal distribution consisting of false votes which were injected. An alternative explanation for the shape has yet to be found.


The U.S. 2024 Presidential Election
Without publicly available election audits being pursued by Kamala or (as far as we know) intelligence agencies, several volunteer organizations have sprung up in their stead.
Election Truth Alliance is a small volunteer group which has so far found the Russian tail in data available in the swing states of both Nevada and Pennsylvania. If their data is correct it would mean the election outcome should have been different. They’re running a petition to audit the votes, and a fundraiser for when the petition fails.
SMART elections is one of the first volunteer groups to have raised the alarm. They published the first findings of a phenomenon called ballot drop-off, which is a measurement of how often ballots vote entirely for one party, but the opposite party for president. When widespread, consistent, and with one-sided biases, this can be a sign of vote tampering.
Let me be clear: these organizations are not claiming this is evidence of fraud. Weird data patterns alone are not enough for that. But they are reasonable cause to keep digging. And that requires time, money, and loud public demands.
Per-Machine “Turnout” Analysis
The data made available for analysis by counties is limited. They release the proportion of vote which went for each candidate, with the highest granularity ranging from the precinct level (Pennsylvania) to the voting machine itself (Nevada). When data is analyzed carefully however, one can learn a lot.
One angle to look at the data from with a histogram. In the following chart, datapoints are lined up in percentiles left to right. A precinct all the way left would have had nobody show up to vote, and on the right would have gotten votes from everybody who’s registered. The Y axis is the number of votes which each candidate got in that precinct. Just mail-in votes first:

Some things stand out:
Harris got a lot more votes. This makes sense, as cities are expected to lean heavily blue, as is mail-in voting.
This looks at total vote numbers, so as expected the right-hand side of each line is a little higher than the left-hand side.
There’s big spikes in the blue line. I haven’t looked at which counties those are, but I’m guessing some counties pull strongly towards Harris.
Now, looking at election-day results:

What stands out?
Still, Harris got more votes here. Also note the absolute numbers are different, topping out at ~30k votes, not ~10k. Curves are correspondingly less jaggy.
It’s hard to be sure, but there’s what could be a tail on the right hand side of the red votes. It looks like it’s dropping off, but around 60% turnout it spikes back up again sharply. This is far from conclusive, but I built a little tool so you can try for yourself fitting curves to these charts.

This doesn’t really seem too crazy by itself, but it demonstrates a concerning trend. This same shape appears in precinct after precinct in Pennsylvania, and tabulator after tabulator in Nevada. The research is still ongoing.

Counting Votes-Per-Machine in Nevada
Election Truth Alliance’s analysis is able to look at the results of individual voting machines in Nevada. They look at each machine, count the number of votes on it at the end of the day, and look at the fraction per candidate.
For machines with low numbers of votes, you should expect to see a wide range of percentage from each candidate, as a small number of polarized people in that area can make a big difference. There should be a convergence as number of votes per machines goes up.

..And it does cluster, but not in the way one would expect:
In a fair election, you would expect to see the right hand of the graph converging in about the middle of the dots on the left hand. In this graph, that would be at about a 50% share.
In a fair election, you would expect to see the convergence happen gradually as counts per machine go upwards.
Neither of those is the case here. Around the 300 votes-per-machine mark, there’s a sharp upswing towards 60% trump. That line is held out to exactly 60% at the very rightmost dot.
Votes are Aligning to Exactly 60% Trump
Another analysis also counts votes per machine, but this time at a tabulator level, not per-voting-machine. Similarly, we would expect a noisy/jaggy line in the beginning (where sample-sizes are smaller), and convergence to the average outcome as the number of votes per tabulator go up. Indeed, we do see this. The line is thicker on the left (especially obvious in the flattish looking part), and narrow on the right.

But we see something else as well: a seeming convergence around 45% trump on the left for low numbers of votes, then a sudden jump, and then an asymptote heading towards 60% of the vote.
For reference, an asymptote is a curve which always approaches a certain value, but will never reach it.

What could explain this? Could it perhaps be a rural-versus-city difference again? Unlikely. Once you take the geographic location of individual tabulators into account. Mail-in versus in-person selection-bias? Nope – these are all early voting. And neither of those would explain the perfect asymptote.
What could cause this is an algorithm which is designed to fix the vote at 60%, but not activate until there are enough votes in the system to obscure its own operation.
In an adversarial frame-of-mind, this would make sense. Such an algorithm could get past the initial tests done by election staff, and make a high enough margin to be outside of any default hand-recount thresholds❗️
To test this idea, I implemented the same algorithm myself. My script makes 10k tabulators, each with one more vote than the previous. When a tabulator has less than 300 votes, each vote is random. For the 301st vote and onwards, it is biased 60/40. The orange line in this chart should take the same shape as the first chart above:

And it does. There’s the same extremes in the less-than-30 votes area, a flat line around 50 when less than 300, and then a sharp increase after that point, gradually reaching an asymptote around 60%.
For comparison, I included a blue line which is an election which pulls 60% to one side, regardless of how many might have people voted before you at the polls. It stays centered on 60% the whole time, and is always just a little bit above the orange line (because it doesn’t have those first 300 votes on each tabulator dragging it down).
Comparison to other elections
In comparison, we can look at the 2014 Wisconsin governor's race. The green line is fair, and the red lines are stuffed with more fake votes as more votes go into the machine. This was a slightly different algorithm (going up forever, instead of targeting 60%), but a sign of fraud.

Ballot Drop-off Analysis
The simplest way to fake a ballot is to change the selection of their vote for President, while leaving the rest of the ballot unchanged. This is simple enough, but leaves a tell.
People often vote consistently and predictably along party lines. If you change just their vote for the office of the president, it will show an increased-from-normal fraction of people not voting along party lines. This is called Drop-off.
People broke party lines a shocking amount in the 2024 election. To the extent that immediately afterwards, AOC took to social media to ask why.
SMART Elections did some of the first data-science here, comparing the drop-off in swing states and other states. They found that the Drop-off was always a little bit in Trump’s favor, but it was hugely in Trump’s favor in the swing states.

Again, this doesn’t mean much on its own. Swing states are swing states for a reason, after-all. Probably because they don’t like to vote on party lines.
Where it gets weird is when we look at every county – here’s North Carolina and Ohio.
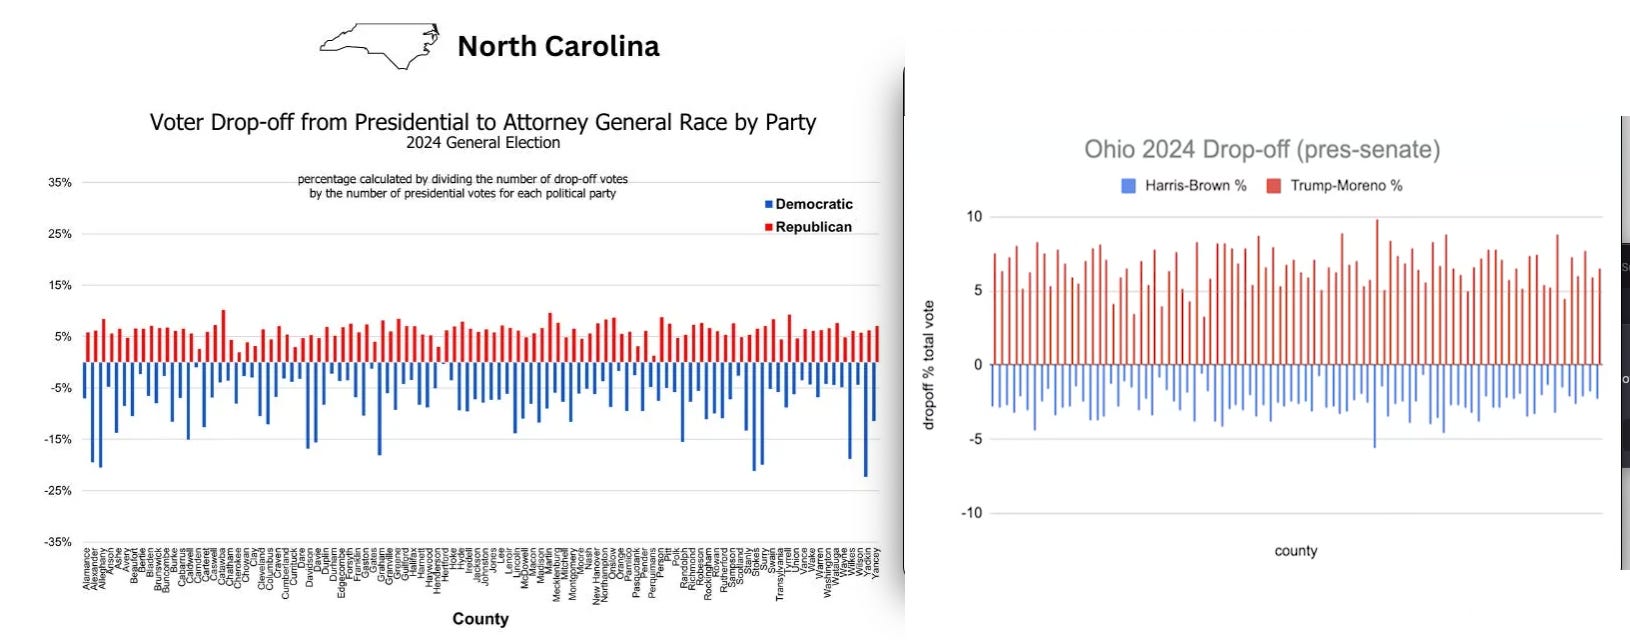
What I see is drop-off favoring Trump, which is expected. But we also see total uniformity. Not one county had more Republicans that favored Kamala than Democrats who favored trump. Not even in Deep-Blue Durham, NC and Columbus, Ohio – where Kamala won 78% and 95% of the vote, respectively.
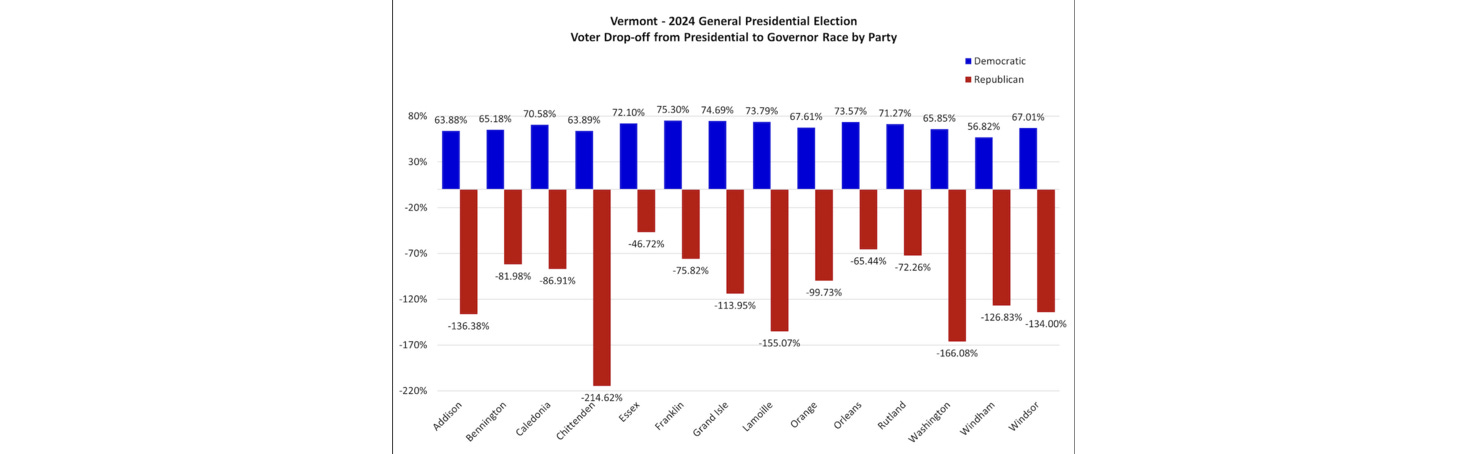
Below are some more typical elections. Note that bars of both colors appear on with both positive and negative dropoff.

In software engineering, we have the term a "code smell" to indicate something that is not objectively wrong, but a sign of something which feels like it will lead to trouble later. Indeed, these explorations from SMART Election’s are what inspired Election Truth Alliance to take on their first analysis of Nevada.
These are not a sure sign of something wrong. For example in Vermont we essentially had no Democrat competing with our incumbent Republican governor, despite the state being very Democratic-leaning in general. That meant that 100% of counties had strong negative Republican Drop-off.
You can hear directly from researchers at Election Truth Alliance, here:
What's next for Election Truth Alliance?
You may be wondering why, if we’re trying to find fraud, we’re just looking at end-of-day totals for voting machines, or even higher up at the tabulator or precinct level. Unfortunately, no state makes better data publicly available by default. In order to get it, you either have to not concede the election (we’re way past that), the state needs to ask for a recount, or a third party organization needs to sue for the right to do forensic audit.
We learned from the 2000s, and the paper ballots at least exist. Suspicions of the source of fraud center on how the ballots were scanned, not how they were marked. So a hand recount has a chance of actually showing something different. You can support that by signing this petition on Change.org.

It won’t always be possible to get states to intervene. To that end, they are establishing a legal fund to get the data anyway. This is not cheap – estimates range from $30k to $4M depending on scope. They are running a fundraiser on GoFundMe.

Until Next Time
Unfortunately, the story doesn’t end here. In my next post, I’ll be talking about hypothetical attack vectors which could have made possible an attack of this magnitude. The post will be both grounded in past computer-hacks and also, in parts, far more speculative than some of my other posts.
We’ll talk about election-day bomb threats, Elon Musk’s odd campaign to get signatures in swing states (and why he’s doing it again now in Wisconsin), and DOGE’s crazy purges (including defunding the agency which made the russian tail explainer used in this post). We’ll also discuss members of the DOGE team, and the large disparities seen on election betting sites in the days leading up to the election.


Share this post